What is the Project Brief?
Before designing any architecture, we should always start with the problem we are trying to solve.
For this project the questions were simple:
- How does the heating oil industry actually work?
- What will this new disaster push oil prices to?
- How long do I need to ride it out?
On the surface, these don’t sound like architecture questions at all. They sound like questions about economics or energy markets.
But from a data perspective, they immediately translate into architecture concerns.
For example:
Do we already have the data required to answer these questions?
The answer here is no.
The data required for this project does not exist in my data estate. It needs to be sourced externally.
That means we immediately introduce some architectural considerations:
- external data ingestion
- public data reliability
- long-term storage
- repeatable analysis
Since the focus is the UK heating oil market, the data sources also need to be relevant to that region.
That means looking at things like:
- UK energy price data
- oil market pricing
- global geopolitical events
Most of this information is public data, so thankfully we don’t need to worry too much about things like licensing, compliance, or restricted datasets.
What Data Do We Actually Need?
If we reduce the problem down to its simplest form, we really only need two core datasets.
1. Oil Price Data
This allows us to observe:
- historical trends
- price spikes
- recovery patterns
For example:
- Brent crude prices
- UK heating oil prices
- refined fuel prices
2. Global Events
The second dataset is far less structured.
We need to track major geopolitical or economic events that could influence the oil market.
Examples include:
- wars
- sanctions
- shipping disruptions
- global recessions
This dataset helps answer the key question:
What caused the price movement?
This Is a Small Pipeline… But It Still Needs Architecture
At first glance, this is a very small solution.
We are talking about:
- two small datasets
- a few transformation steps
- a single graph as an output
It would be easy to throw together a script on a laptop and call it done.
But good architecture isn’t just about scale.
It’s about structure and repeatability.
Even a small pipeline benefits from:
- clear data sources
- predictable processing steps
- reproducible outputs
In other words:
If this breaks in six months, I want to understand exactly how it works.
Platform Choice
Since the Data & Grit website is already hosted on AWS, it makes sense to keep this project in the same ecosystem.
That gives us a few advantages:
- existing infrastructure
- low operational overhead
- simple integration with the website
So AWS becomes the natural platform for the pipeline.
Tooling
For a project of this size, the tooling can remain very simple.
Python
Python is the obvious choice.
Reasons:
- excellent libraries for data work
- easy to maintain
- easy to automate
- widely portable
For a small analytics pipeline like this, Python is more than enough.
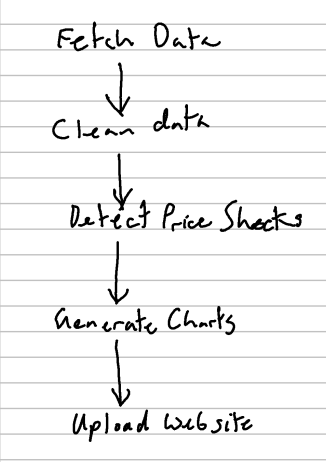
Pipeline Processing
The pipeline itself has a few straightforward stages.
Gareth Winterman